To make use of the fraud-on-the-market theory in securities litigation, a plaintiff must demonstrate that the security in question trades in an efficient market. To do so, economic experts routinely present measures of various commonly-accepted factors or indicators of efficiency such as trading volume, bid-ask spread, analyst coverage etc. for the stock in question as evidence for efficiency. Such quantification of factors, however, does not provide insight into how a particular value of a factor relates to the efficiency of the stock. Our objective in this paper is to provide this information. We present a means to benchmark a stock against the universe of stocks considered to trade in open and well-developed markets. The universe of stocks consists of stocks listed on the NYSE and Nasdaq stock exchanges. For the commonly-accepted factors, we rank the stocks in this universe from best to worst. This allows the researcher to assess, relative to the universe of stocks, the percentile ranking of the stock that is the subject of the efficiency inquiry. If the percentile ranking is an outlier for a given factor, then that factor does not support a finding of market efficiency. On the other hand, if the percentile ranking is within the norm of the universe of stocks, then that factor does support a finding of market efficiency. We propose that if a security falls within the 10th percentile for a factor in the opposite direction of what one would expect for an efficient stock, then that factor does not weigh in favor of market efficiency.
I. Introduction
Under Section 10(b) of the Securities Exchange Act of 1934 and the Securities and Exchange Commission’s (SEC) Rule 10b-5, it unlawful to make any material misstatement or omission in connection with the purchase or sale of any security.1 For investors to recover damages for violations of Section 10(b) and Rule 10b-5, one of several requirements is to prove that they relied on the defendant’s misrepresentations in making the decision to purchase or sell a company’s security.2
In a landmark decision, Basic Inc. v. Levinson (1988), the U.S. Supreme Court recognized that requiring such direct proof of reliance “would place an unnecessarily unrealistic evidentiary burden.”3 The Supreme Court held that investors could satisfy the reliance requirement by invoking a rebuttable presumption, known as the fraud-on-the-market theory, that the price of a stock traded in an efficient market reflects all publicly available information, and hence, the material misrepresentations.4 That is, if a stock trades in an efficient market, any investor who transacts at the market price may be considered to have relied on the misrepresentations. To utilize the fraud-on-the-market theory, a plaintiff must therefore demonstrate that the security traded in an efficient market.5
The efficient market hypothesis (EMH) is one of the bedrocks of modern finance theory.6 In the context of securities litigation, a market for a stock is said to be efficient if the stock price quickly reflects all publicly available information.7 In securities litigation, this is sometimes referred to as informational efficiency.8 The notion behind an informationally efficient market is that as new information enters the market and causes investors to revise their expectations about the future cash flows of a company, the trading based on investors’ revised expectations causes prices to quickly incorporate all publicly available information.
Since Basic Inc. v. Levinson, economic experts have provided courts with evidence of market efficiency for individual stocks. Such evidence has generally involved various measurable characteristics or factors as indicators of efficiency. The court in Cammer v. Bloom first enumerated five factors that it considered relevant for market efficiency.9 Since Cammer, other courts have considered additional factors. The following factors are now routinely presented in almost every expert report examining the efficiency of the market for a given stock: (1) trading volume; (2) number of analysts following and reporting on the security; (3) bid-ask spreads; (4) level of institutional ownership; (5) market capitalization of the company; (6) ability to sell short; (7) presence of market makers; (8) serial correlation in the stock’s price; and (9) cause-and-effect relationship between new information and changes in the security’s price.10
A question that gets consistently asked is how a particular value of a factor for a given subject stock relates to the efficiency of that stock. This question is a fair one, as it is akin to a doctor stating that the platelet count for a patient is 40,000 per microliter of circulating blood without providing the range of values considered normal. Unless it is known that the normal range for platelet count is 150,000-450,000 per microliter of circulating blood, it is not possible for the patient to know that she has a low platelet count.11 In similar vein, we believe that having appropriate benchmarks for factors considered in the assessment of market efficiency for a stock can assist courts, and the legal community in general, in making a determination whether the stock in question can be reasonably expected to incorporate all publicly available information. To that end, we provide benchmarking statistics for market efficiency factors accepted by courts at the class certification stage in Rule 10b-5 securities class action lawsuits.
Our paper provides a means to benchmark a stock against the universe of stocks considered to trade in open and well-developed markets. The universe of stocks consists of stocks listed on the NYSE and Nasdaq stock exchanges (two major stock exchanges considered to be open and well-developed markets).12 For the commonly-accepted factors, we rank the stocks in this universe from best to worst. This allows the researcher to assess, relative to the universe of stocks, the percentile ranking of the stock that is the subject of the efficiency inquiry. If the percentile ranking is an outlier for a given factor, then that factor does not support a finding of market efficiency. On the other hand, if the percentile ranking is within the norm of the universe of stocks, then that factor does support a finding of market efficiency. Using these rankings, we propose numerical thresholds that can be used to assess market efficiency in securities litigation.
The notion of efficiency we present is a relative one. We believe that relative efficiency is useful because “perfect efficiency is an unrealistic benchmark that is unlikely to hold in practice.”13 Frictions, such as trading costs and costs of gathering information, exist for all stocks, more for some stocks than others. Efficiency statistics for a large group of stocks traded on well-developed markets can thus provide insights into the relative efficiency for a given stock. Such benchmarking is also consistent with the notion emphasized by the Supreme Court in Halliburton Co. v. Erica P. John Fund, Inc. that “market efficiency is a matter of degree.”14
Although the efficiency factors mentioned above are used ubiquitously in the assessment of market efficiency in the context of securities litigation, the subject is not without its detractors.15 Some have attempted to downplay the significance of many of these factors, arguing that the only relevant factor is the cause-and-effect relationship, based on an event study, between new information and changes in the security’s price. While academic research to a large extent has examined the relationship between cause and price adjustments for various types of corporate events, such as earnings and merger announcements, security issues, among others, the conclusions about overall market efficiency are based on the average response of a large number of stocks, not an individual stock.16 In the context of an evaluation for a single stock, as is the requirement in securities litigation, it is often the case that there is an insufficient number of a single type of event (such as earnings releases) occurring during a class period to conduct a statistically valid event study.17 In such cases, the other factors play a critical role in shedding light on the relative efficiency for the stock in question. Moreover, these factors used to assess market efficiency themselves have support in academic literature as indicators of efficiency.18
While previous research on market efficiency has guided and informed the evaluation of market efficiency for stocks in the context of securities class actions, to our knowledge, there is no study that provides systematic benchmarks, as distinct from anecdotal evidence, for measurable characteristics of stocks that have been accepted in the literature and in the courts as indicators of market efficiency. This is the goal of our paper.
The remainder of this article is organized as follows. In Section 2, we describe the sources of data used in this paper. In Section 3, we discuss the indicators of market efficiency accepted by courts in securities litigation cases and provide benchmarking statistics for each indicator. We then assess the correlation among these factors and propose numerical thresholds that can be used to assess market efficiency in securities litigation. We finish with concluding remarks in Section 4.
II. Data and Methodology
We collected data from the following sources: The Center for Research in Security Prices (CRSP); Institutional Brokers’ Estimate System (I/B/E/S); Compustat; and Standard & Poor’s (S&P) Capital IQ.
From CRSP, we obtained daily data from 2010 to 2018 on stock prices, bid and ask prices, volume, shares outstanding, and stock returns for all U.S. stocks listed on the NYSE or Nasdaq stock exchanges.19 Using the stock level data, we calculated daily turnover, bid-ask spread, and market capitalization.20 For three-year intervals, for each stock, we then calculated average daily turnover, average bid-ask spread, and average market capitalization. To retain securities representative of the three-year periods analyzed and to eliminate securities with potential data issues, we required a security to have volume data for at least 75% of the trading days.
From I/B/E/S, we obtained monthly level data from 2010 to 2018 on analyst coverage for individual stocks and merged it with CRSP stock level data using the I/B/E/S linking table provided by Wharton Research Data Services (WRDS). As of June 2019, when we obtained the data, the linking table was only available through June 2018. As a result, the analysis related to analyst coverage ends in June 2018. As before, we retained data for U.S. stocks listed on the NYSE or Nasdaq stock exchanges and restricted the analysis to those stocks used in the analysis of turnover, bid-ask spreads, and market capitalization. For three-year intervals, for each stock, we calculated the average number of analysts making buy/hold/sell recommendations.21
For U.S. stocks listed on the NYSE and Nasdaq stock exchanges used in the analysis of turnover, bid-ask spreads, and market capitalization, where available, we obtained end-of-year data from 2010 to 2018 on percent of shares held by institutions from S&P Capital IQ. For three-year intervals, for each stock, we then calculated average percent of shares held by institutions.
Finally, we obtained bi-monthly data on short interest (for the period 2010 to 2018) from Compustat supplemental short interest datafiles available on WRDS. We merged this data with shares outstanding from the Compustat security data. Then, for the same set of companies used in the analysis of turnover, bid-ask spreads, and market capitalization, we calculated average short interest as a percent of shares outstanding, for the three-year intervals.
III. Results
We first present percentiles for various indicators of market efficiency. We then assess the correlation among the various factors. Finally, we propose thresholds for the efficiency factors that can be used to assess market efficiency of a single stock in securities litigation.
A. Benchmarking Statistics for Indicators of Market Efficiency
1. Trading Volume
Volume is an indication of the “absorptive capacity of the market” and is often used as a proxy for liquidity.22 High trading volume facilitates arbitrage activity. High volume also generally signals “significant investor interest in the company”23 which facilitates incorporation of new public information into stock prices. Trading volume is, thus, considered a factor in the determination of market efficiency. Trading activity has increased significantly in recent years in part facilitated by the advancement in technology that has led to an increase in high-frequency trading by institutions24 and as online brokerage accounts have made it easier for retail investors to trade. This trend in increased trading activity has been shown to be associated with improved market efficiency.25
Weekly trading volume is one of the market efficiency factors enumerated in Cammer26 and widely accepted by courts in securities class action matters.27 In Table 1, we present various percentiles over three-year periods for average daily turnover for companies listed on the NYSE and Nasdaq stock exchanges. Turnover was higher during 2016-2018 relative to the prior six years. The median daily turnover was 0.71% during 2016-2018, whereas it is was 0.62%-0.63% during 2010-2015. The 5th percentile daily turnover was between 0.08% and 0.12% and the 95th percentile was between 2.14% and 2.95%.
Table 1: Percentiles over Three-year Periods for Average Daily Turnover
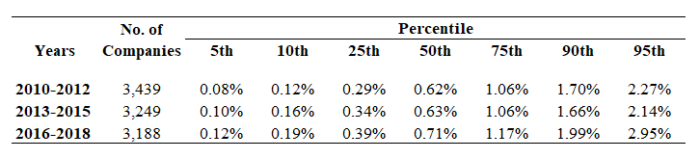 Percentiles are based on average daily turnover described in Section II.
2. Research Analysts
Securities analysts collect information on specific companies and in conjunction with their research and assessment of relevant industry and market conditions publish research reports that contain discussion of recent company-specific events, their projections for future earnings, price targets, and buy/hold/sell recommendations. New material information disseminated through these research reports is often used by investors in their trading decisions.28 Coverage by analysts, thus, increases market efficiency as research provided by these professionals who expend considerable resources is reflected in stock prices through trading activity. For example, the initiation of analyst coverage is considered to be value-relevant information and has been shown to impact stock prices.29 There is also a large body of literature showing that markets react to analyst forecasts, target prices, and ratings changes.30 As such, analyst coverage is widely regarded as an indicator of market efficiency (Thomas and Cotter, 2000).31
The importance of analyst coverage to investors is also evident from the wide use of the collection of future earnings estimates put forth by research analysts, commonly referred to as consensus estimates. Consensus estimates are compiled by financial services firms such as Thomson and S&P Capital IQ. Thomas and Cotter (2000) comment on the relevance of consensus estimates to the investing community, noting that, “First Call’s [acquired by Thomson] earnings estimate dissemination service is a very important conduit for information from companies to their investors. Investors believe that First Call data is so important that they (investors) actually purchase consensus earnings estimates and short analyst write-ups (First Call Notes) that sell-side analysts publish.”32
In line with academic research, the role of research analysts is aptly summed up in the U.S. Supreme Court’s decision in Dirks v. Securities Exchange Commission: “[the] value to the entire market of [analysts’] efforts cannot be gainsaid; market efficiency in pricing is significantly enhanced by [their] initiatives to ferret out and analyze information, and thus the analyst’s work redounds to the benefit of all investors.”33
Coverage by research analysts is another Cammer factor that is ubiquitously used by courts in their determination of market efficiency.34 The Cammer court reasoned that “[t]he existence of such analysts would imply, for example, the [company auditor] reports were closely reviewed by investment professionals, who would in turn make buy/sell recommendations to client investors. In this way the market price of the stock would be bid up or down to reflect the financial information contained in the [company auditor] reports, as interpreted by the securities analysts.”35
Table 2 shows various percentiles over three-year periods for the average number of analysts covering companies listed on the NYSE and Nasdaq stock exchanges. The top 10% of the companies had on average more than 20 analysts making buy/hold/sell recommendations, whereas the bottom 10% of the companies had less than 2 analysts making recommendations. The median analyst coverage was 6-7 analysts.
Table 2: Percentiles over Three-year Periods for Average Analyst Coverage
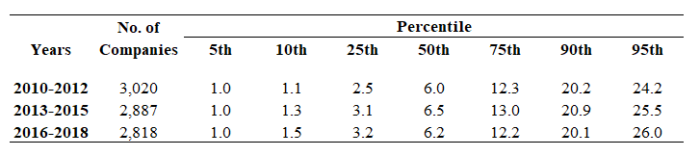 Percentiles are based on average analyst coverage described in Section II.
3. Bid-Ask Spread
The quoted bid price represents the highest price a buyer is willing to pay, and the ask (or offer) price represents the lowest price a seller is willing to accept. In other words, the bid price reflects a concession for an immediate sale by a seller and the ask price reflects a premium for an immediate purchase by a buyer.36 Demsetz first related the spread between bid and ask prices as a component of transaction costs.37 Low transaction costs reduce impediments to trade, stimulate arbitrage activity, and can thus facilitate incorporation of new information into stock prices. Thus, low bid-ask spreads are often used an indication of an efficient market.38
Because liquidity can be measured by the cost of immediate execution of a transaction, bid-ask spreads are also widely used as a measure of liquidity.39 Higher (lower) spreads, i.e., diminished (greater) liquidity has been shown to be negatively correlated with other liquidity measures such as trading volume and the number of shareholders.40 Lower liquidity stocks have historically received higher returns, all else equal.41
Table 3 reports the various percentiles over three-year periods for average daily bid-ask spreads for companies listed on the NYSE and Nasdaq stock exchanges. The results show that spreads have generally been narrowing over time. The 95th percentile for bid-ask spreads has narrowed from 4.24% during 2010-2012 to 2.70% in 2016-2018. For the 10% of the companies with the lowest spreads, spreads were lower than 0.05%, and the median spread was between 0.12% and 0.18%, for the years 2010-2018.
Table 3: Percentiles over Three-year Periods for Average Bid-Ask Spreads
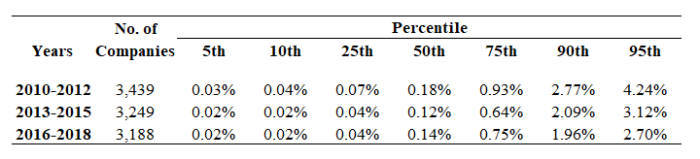 Percentiles are based on average bid-ask spreads described in Section II.
4. Institutional Ownership
Sophisticated investors, such as institutional investors, obtain and assess information quickly. Examples of institutional investors include mutual funds, pension funds, investment banks and other financial institutions that hold large amounts of assets under management. These investors generally have large amounts of capital available to trade based on their assessments. The process of trading based on new important information facilitates market efficiency by impounding the new information in stock prices. Indeed, the level of institutional ownership has been suggested as a proxy for market efficiency.42 Institutional ownership has also been shown to be correlated with analyst coverage, another indicator of efficiency.43
Moreover, shares held by institutions are often available for borrowing by short sellers. Thus, by facilitating the views of short sellers to be incorporated into the stock price, institutional ownership of shares enhances arbitrage activity and contributes to the efficiency of the stock. Courts also consider institutional ownership in the determination of market efficiency for a stock.44
Table 4 shows various percentiles over three-year periods for average institutional ownership. The median institutional ownership was between 65% and 68%. The 25th percentile was between 30% and 34%; and the 75th percentile was between 88% and 90%. The 95th percentile was greater than 100%. Institutional ownership can be greater than 100% when the original ownership of shares and the ownership of shorted shares borrowed from institutions are both reported.
Table 4: Percentiles over Three-year Periods for Average Institutional Ownership
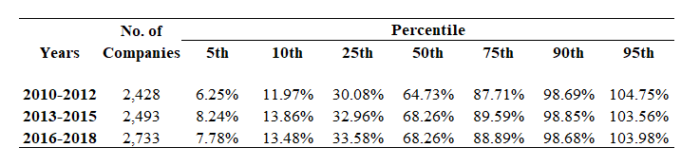 Percentiles are based on average institutional ownership described in Section II.
5. Market Capitalization
A large market capitalization is an indicator of market efficiency because there is generally greater incentive for investors to gather and analyze information about large corporations. Greater investor interest facilitates the incorporation of new public information into stock prices and enhances market efficiency. It has been shown that large market capitalization is correlated with other indicators of market efficiency such as the level of institutional ownership and greater analyst coverage.45 Market capitalization is also accepted by courts as an indicator of efficiency.46
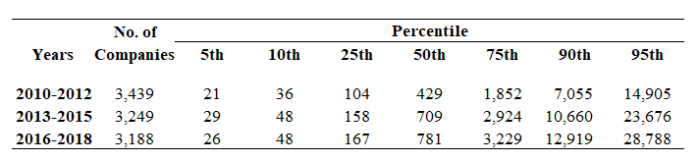
Table 5 shows various percentiles over three-year periods for average market capitalization for companies listed on the NYSE and Nasdaq stock exchanges. Driven by the rising stock market, the market capitalization has increased over time, especially for the larger companies. The 95th percentile has increased from $14.9 billion in 2010-2012 to $23.7 billion in 2013-2015 and $28.8 billion in 2016-2018. During this time period, the market capitalization of the median company increased from $429 million to $709 million and $781 million, respectively. The smallest 10% of the companies had a market capitalization of less than 50 million on average.
Table 5: Percentiles over Three-year Periods for Average Market Capitalization (in millions)
 Percentiles are based on average market capitalization described in Section II.
6. Short Interest
Short selling enables arbitrage activity as it allows short sellers to trade on their perceived negative views. Because investor activity is a key component of a well-functioning efficient market, short selling, therefore, in general facilitates market efficiency as the views of the short sellers get impounded in the stock price.47 Excessive short interest, however, can indicate an impediment for prices to fully adjust if short investors have difficulty in borrowing shares or covering short positions. Courts have also considered the level of short interest as another indicator of market efficiency.48
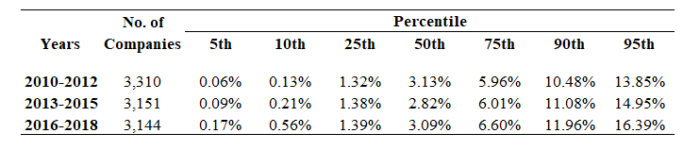
Table 6 reports the various percentiles over three-year periods for average short interest as a percent of shares outstanding for companies listed on the NYSE and Nasdaq stock exchanges. The median short interest as a percent of shares outstanding was in the 2.82%-3.13% range; the 5th percentile was between 0.06% and 0.17% and the 95th percentile was between 13.85% and 16.39%.
Table 6: Percentiles over Three-year Periods for Average Short Interest as a Percent of Shares Outstanding
 Percentiles are based on average short interest as a percent of shares outstanding described in Section II.
7. Market Makers
Another factor set forth in Cammer is the presence of market makers and arbitrageurs. The Cammer decision was rendered in the context of a stock traded in the 1980s in the over-the-counter market (a reporting network in which transactions were reported to the National Association of Securities Dealers for publication) and listed on an early version of Nasdaq which was not a national exchange at the time.49 Since then, with vast technological improvements, Nasdaq today accounts for 1 in 10 of the world’s securities transaction50 and is a much different market than it was in the 1980s. It is a market structure where market participants comprised of market makers, alternative trading systems (ATSs) that include electronic communication networks (ECNs), among others, compete for order flow.
Indeed, today, under the unlisted trading privileges (UTP) rule of the SEC, stocks can be traded in markets other than where they are listed.51 Thus, in order to compete for order flow, each marketplace takes measures to create an infrastructure that promotes liquidity. To that end, the role of market makers on Nasdaq is to enhance the liquidity of the market. NYSE similarly utilizes a single Designated Market Maker (DMM) for each listed stock to enhance liquidity.52
In sum, the role of market makers of providing liquidity to traders,53 which facilitates an efficient market, is consistent with the Cammer court’s reasoning that “[t]he issue here is whether market makers in the over-the-counter market [] provided a sufficiently fluid and informed trading environment so that when material information [] was disseminated, investors had available to them an opportunity to trade at informed, and therefore appropriate, bid and asked prices.”54 The presence of market makers is accepted by courts as an indicator of an efficient market.55 We do not provide any statistics for market makers in this paper because all NYSE stocks have a single DMM for each listed stock to enhance liquidity; stocks listed on Nasdaq can have multiple market makers.
8. Serial Correlation
In an informationally efficient market, all publicly available information, including past prices, are reflected in stock prices. To test whether stock prices follow a “random walk”,56 i.e., future prices cannot be predicted based solely on past prices, economic experts in securities litigation generally use the first-order autocorrelation of daily stock-price returns. A statistically insignificant result implies that there are no unexploited arbitrage opportunities based on historical prices.
A statistically significant result, however, does not necessarily imply that the stock trades in an inefficient market. Fama notes that it is unlikely that the observed levels of serial correlation “can be used as the basis of substantially profitable trading systems.”57 He further explains that any advantage from a trading scheme designed to exploit the serial correlation disappears when trading costs are accounted for and concludes that, “in spite of any statistical significance they might have, from an economic viewpoint the departures are so small that it seems hardly justified to use them to declare the market inefficient.”58
Furthermore, the presence of statistically significant serial correlation over short subperiods may not necessarily be an indication of systematic over- or under-reaction but instead may be driven by instances in which there are consecutive days on which important news is disseminated. Under these circumstances, statistically significant serial correlation would not indicate that any arbitrage opportunity existed, but rather would be a result of consecutive days with important news.
The absence of serial correlation is another factor considered by courts in rendering their decisions concerning market efficiency of a stock.59 To provide benchmarking statistics for the NYSE/Nasdaq stocks, we estimate the following first-order autoregressive equation for every stock during three-year intervals in the 2010-2018 time period:
where, is one-period return on security i in period t in a three-year period y, is the one-period lagged return on security i in period y, and is the error term.
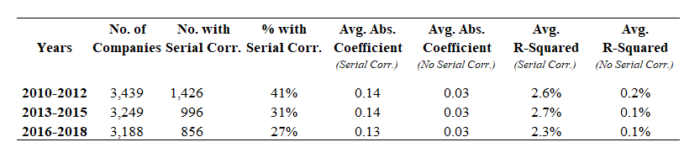
The results in Table 7 show that 27% of the stocks exhibited first order serial correlation during 2016-2018 and the percentage was even higher during 2010-2015. The average absolute coefficient on the lagged returns for these stocks, however, was only 0.13-0.14 and the average R-squared was less than 3%.
Table 7: Results of First Order Serial Correlation
 Daily returns are computed when prices are available on consecutive trading days.
9. Cause-and-Effect Relationship
Finally, we present benchmarking statistics for a factor considered to be evidence of a cause-and-effect relationship. Indicators of cause-and-effect, the fifth and final Cammer factor, seek to assess the relationship between new information (cause) and the resulting stock-price movement (effect). While economic experts have performed various different types of tests to illustrate the relationship between new information and stock price movements, in this paper, given the length of time studied and the breadth of companies covered, we focus on a relationship that can be readily estimated and generally illustrates the cause-and-effect relationship consistent with an efficient market: the relationship between stock returns and trading volume.
For over four decades, economists have studied the relationship between price changes and trading volume in financial markets and the empirical evidence overwhelmingly supports that volume is positively related to the absolute value of the price change.60 Karpoff summarizes the extensive research that has documented this relationship and concludes that the correlation can likely “be traced to their common ties to information flows.”61
A positive correlation between absolute stock returns and trading volume is, therefore, also an indicator of market efficiency because it is expected that if investors have heterogenous beliefs, new important information will cause both trading activity to increase and price changes to occur.62 Therefore, days with important news will tend to correspond with greater than normal trading volume as different investors alter positions in accordance with their differing valuation views. Evidence of positive co-movements between absolute value of price changes and trading volume has often been presented by economic experts and accepted by courts as evidence of a cause-and-effect relationship between new information and price changes.63
For each security i, we regress the daily absolute return on log volume over three-year periods:
where, is the daily absolute return on security i in period-t over a three-year period y, is the trading volume for security i in period-t over a three-year period y, and is the error term.64
Table 8: Results of the Relationship Between Stock Returns and Trading Volume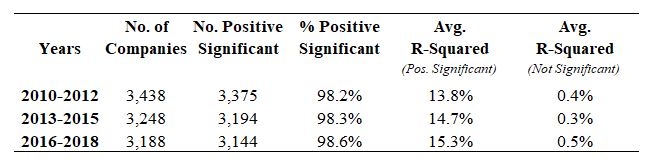
Daily returns are computed when prices are available on consecutive trading days.
Consistent with the literature, the results in Table 8 show that virtually all the stocks exhibit a statistically significant relationship between absolute stock returns and trading volume.
B. Correlation Among the Various Efficiency Factors
Because the various factors discussed above are all indicators of market efficiency, we expect to find a strong correlation among these factors. Table 9 shows the pairwise correlation among the various factors for the different time periods studied in this paper.
The pairwise correlation is calculated using the percentile rankings between each pair of factors for the securities. For serial correlation and the relationship between return and volume, we use the percentile rankings of the p-values of the coefficients on the lagged returns and the coefficients on log volume, respectively. Further, we reversed the percentile rankings for bid-ask spreads and serial correlation because lower rankings for these factors imply greater efficiency. The results indicate statistically significant correlations among all the factors. For example, during 2016-2018, the correlation between bid-ask spreads and market capitalization was extremely high at 94% and statistically significant at the 1% level.
Table 9: Pairwise Correlation Among the Indicators of Market Efficiency
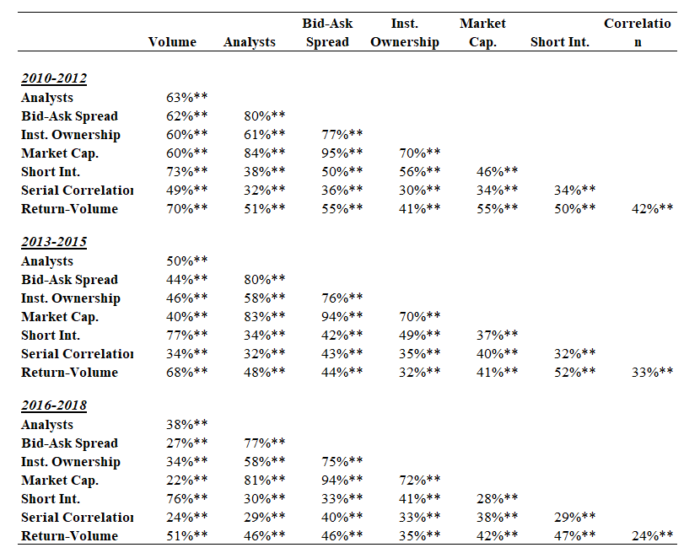 Note: ** denotes statistical significance at the 1% level.
C. Using the Results to Assess Market Efficiency
Because the NYSE and Nasdaq stock exchanges are generally considered to be open and well-developed markets,65 we believe that it is reasonable to propose that if the value of an efficiency factor for a security falls within the 10th percentile for the factor in the opposite direction of what one would expect for an efficient stock, then that factor does not weigh in favor of efficiency. Otherwise, the factor lends support in favor of efficiency. In the Appendix to this paper, we provide a discussion of why the 10th percentile is a reasonable threshold to assess market efficiency.
Using the 10th percentile threshold, the results presented in this paper can assist in determining whether a particular efficiency factor for a stock supports or does not support a finding of market efficiency. For example, the bid-ask spread percentiles in Table 3 can be used to determine whether the bid-ask spreads for a particular stock support a finding of market efficiency. During 2016-2018, if the daily bid-ask spread for a stock was less than 1.96%, then this factor weighed in favor of efficiency.
IV. Conclusion
In line with the reasoning of many courts, we believe that no single factor by itself is determinative of market efficiency for a stock and that the determination should be based on the preponderance of combined evidence from the various indicators of efficiency discussed above.66 Likewise, no single factor provides sufficient evidence to conclude market inefficiency.
Our paper provides, for commonly-used efficiency factors, a means to benchmark a stock against the universe of stocks considered to trade in open and well-developed markets. The universe of stocks consists of stocks listed on the NYSE and Nasdaq stock exchanges. For the commonly-accepted factors, we rank the stocks in this universe from best to worst. This allows the researcher to assess, relative to the universe of stocks, the percentile ranking of the stock that is the subject of the efficiency inquiry. If the percentile ranking is an outlier for a given factor, then that factor does not support a finding of market efficiency. On the other hand, if the percentile ranking is within the norm of the universe of stocks, then that factor does support a finding of market efficiency. We propose that if a security falls within the 10th percentile for the factor in the opposite direction of what one would expect for an efficient stock, then that factor does not weigh in favor of market efficiency. Otherwise, it does.
While experts in securities litigation routinely discuss the commonly accepted factors of market efficiency for the subject stock as evidence for efficiency, benchmarking the efficiency factors provides a yardstick to measure the degree of support that a factor provides or does not provide. Thus, this benchmarking provides a highly useful and objective means of consistently assessing market efficiency in securities litigation. The closer is the percentile ranking to the highest and best value, the stronger is the support for market efficiency. Because of the high correlation among the factors, we expect that efficient stocks will fare well among most factors. Furthermore, stocks that rank poorly among most factors demonstrate a lack of support for a finding of market efficiency in securities litigation.
Appendix
As discussed, for each factor we rank the universe of stocks traded on well-developed and open markets from the best to the worst and use this ranking to obtain various percentile values for each factor. For any factor, a researcher can use these benchmarking statistics to assess whether the value of a particular factor for a given stock is an outlier relative to the universe of stocks. If it is an outlier, then that factor does not support a finding of market efficiency. Otherwise, the factor does support a finding of market efficiency.
Although we do not conduct hypothesis testing, it is instructive to look at the principles of such testing in order to understand why we propose the 10th percentile (as opposed to, say, the 5th percentile) threshold for determining efficiency of a stock.
Hypothesis testing typically involves the following steps: (1) stating the null hypothesis; (e.g., population mean = 0); (2) determining the distribution of the test statistic under this null hypothesis (e.g., finding the distribution of the test statistic under the null hypothesis that population mean is zero);67 (3) calculating the test statistic from a sample (e.g., calculating the t-statistic from a sample); and (4) comparing how extreme the value of the test statistic is in terms of the distribution obtained in Step 2. Depending on the level of significance (α) selected, if the observation lies in the extreme of the possible values, it is considered as an evidence against the null hypothesis. The level of significance, α, usually selected is 1%, 5% or 10%.
Hypothesis testing results in two types of potential errors: Type I error and Type II error. Type I error is rejecting the null when it is true; and Type II error is failing to reject the null when it is false. The magnitude of α affects the likelihood of both these errors. Holding sample size constant, a higher selected α increases the likelihood of Type I error and decreases the likelihood of Type II error. This is because increasing α makes it more likely that the null hypothesis will be rejected. Similarly, lowering α decreases the likelihood of Type I error and increases the likelihood of Type II error. The latter also implies a decrease in power of the test, because power equals one minus the likelihood of Type II error.
There may be economic reasons to minimize the Type I error at the expense of the test’s power or vice versa. For example, assume one is performing a statistical test on the efficacy for a cancer drug. The hypothesis being tested is that the drug reduces the size of tumors (null: drug is ineffective). Further assume that there are very serious side effects associated with the drug. One can imagine a situation in which the researcher focuses on minimizing the chances of concluding from the data that the drug works when in reality it fails to reduce tumor size (Type I error). The economic basis for minimizing the Type I error in this example is that, because of the serious side effects, one may wish to have greater assurance that the drug is truly effective.
Conversely, suppose that there are no adverse side-effects at all for a cancer drug. In this case one can imagine just the opposite–that the researcher focuses on minimizing the Type II error. That is, the researcher’s focus is on reducing the chances of concluding from the data that the drug does not work when in reality it does reduce tumor size. Since the drug has no adverse side effects, there is limited risk of using a drug that may not be effective in reality.
In the hypothesis testing framework, for our analysis, Type I error would be concluding that value of a factor for the subject stock is an outlier, when in truth it is not an outlier. And, Type II error would be concluding that the value of a factor for the subject stock is not an outlier, when in truth it is an outlier. The figure below depicts Type I and Type II errors as they relate to the trading volume factor when examining whether the subject company’s trading volume is an outlier or not relative to that for the universe of other stocks.
Hypothesis: Trading Volume is an Outlier Relative to the Norm for Stocks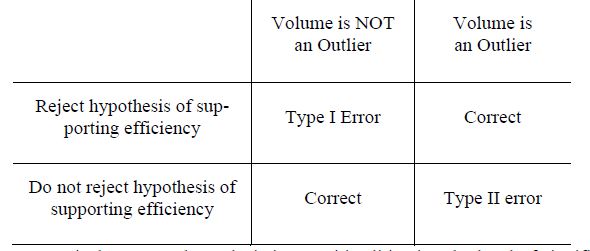
In typical event study analysis in securities litigation the level of significance is 5%. For our tests for market efficiency, we suggest that a 10% level is more appropriate. In simple terms, increasing the level of significance raises the hurdle for concluding that a factor supports market efficiency. Thus, increasing the level of threshold from 5% to 10% is more conservative for proving efficiency.
a Associate Professor, Rochester Institute of Technology.
b Vice President, Forensic Economics, Inc. Corresponding author: sunita@forensiceconomics.com.
c President, Forensic Economics, Inc.
The authors would like to thank Thomas Torchio for research assistance and the editors of the University of Illinois Law Review for helpful suggestions.
1. Section 10(b) states that it is unlawful “[t]o use or employ, in connection with the purchase or sale of any security . . . any manipulative or deceptive device or contrivance in contravention of such rules and regulations as the [SEC] may prescribe[.]” Securities Exchange Act of 1934 § 10(b), codified in 15 U.S.C. § 78j(b) (2020). The SEC enforced this provision under Rule 10b-5 which states in part that is it unlawful “[t]o make any untrue statement of a material fact or to omit to state a material fact necessary in order to make the statements made, in the light of the circumstances under which they were made, not misleading[.]” 17 C.F.R. § 240.10b-5 (2020).
2. See, e.g., Halliburton Co. v. Erica P. John Fund, Inc., 573 U.S. 258, 263(2014).
3. Basic Inc. v. Levinson, 485 U.S. 224, 245 (1988).
4. Id.
5. Id. at 248 n. 27.
6. Based on nested information sets, three forms of an efficient market have traditionally been defined: (1) the weak form, in which historical prices are incorporated into public prices; (2) the semi-strong form, in which all publicly available information is incorporated into public prices; and (3) the strong form, in which all publicly and privately available information are incorporated into public prices. See John Y. Campbell, Andrew W. Lo & A. Craig MacKinlay, The Econometrics of Financial Markets 22 (1997).
7. While courts recognize that the EMH is not without its critics, the U.S. Supreme Court in Halliburton noted “[t]he academic debates discussed by Halliburton have not refuted the modest premise underlying the presumption of reliance. Even the foremost critics of the efficient-capital-markets hypothesis acknowledge that public information generally affects stock prices. See, e.g., Shiller, We’ll Share the Honors, and Agree to Disagree, N.Y. Times, Oct. 27, 2013, p. BU6 (‘Of course, prices reflect available information’).” Halliburton, 573 U.S. at 272.
8. Informational efficiency is concerned with the incorporation of publicly available information into prices. In contrast, fundamental efficiency is concerned with whether the information is incorporated correctly or accurately. For the application of the fraud-on-the-market doctrine, U.S. courts have not required a showing of fundamental efficiency. The U.S. Supreme Court in Halliburton noted “[d]ebates about the precise degree to which stock prices accurately reflect public information are thus largely beside the point. ‘That the . . . price [of a stock] may be inaccurate does not detract from the fact that false statements affect it, and cause loss,’ which is ‘all that Basic requires.’” Id. (quoting Schleicher v. Wendt, 618 F. 3d 679, 685 (CA7 2010)). As another example, the court in In re Xcelera.com Sec. Litig. noted:
The law expects that a share’s market price reflect publicly available information, not that the price perfectly and correctly incorporate it. Basic, Inc. v. Levinson, 485 U.S. at 247. A stock may trade in an efficient market yet be overvalued, and in such cases victims of securities violations—and their correspondingly higher damages—must be taken as they are. Otherwise, a robust stock market would always present a defense at the class certification stage and on the merits that depends on highly subjective, retrospective analysis of what people trading in a stock should have been thinking.
In re Xcelera.com Sec. Litig., 2004 U.S. Dist. LEXIS 29064, at *9–10 (D. Mass. Sept. 30, 2004)). The appeals court concurred:
Defendants do not, and cannot, cite to any language in Basic requiring that the market price of a stock must accurately reflect its fundamental value for purposes of demonstrating market efficiency. In fact, as we noted in PolyMedica, the Supreme Court in Basic declined to explicitly address the meaning of market efficiency – much less a fundamental value theory of market efficiency – stating that, “we do not intend conclusively to adopt any particular theory of how quickly and completely publicly available information is reflected in market price.” (citation omitted)
In re Xcelera.Com Sec. Litig., 430 F.3d 503, 510 (1st Cir. 2005)).
9. Cammer v. Bloom, 711 F. Supp. 1264, 1286–87 (D.N.J. 1989).
10. See, e.g., Vinh Nguyen v. Radient Pharms. Corp., 287 F.R.D. 563, 574–75 (C.D. Cal. 2012).
11. See Thrombocytopenia (low platelet count), Mayo Clinic, https://www.mayoclinic.org/diseases-conditions/thrombocytopenia/symptoms-causes/syc-20378293 (last visited Apr. 26, 2020).
12. As noted by the Third Circuit:
Securities markets like the NYSE and the NASDAQ are “open and developed,” see Oran v. Stafford, 226 F.3d 275, 282 (3rd Cir. 2000), and are therefore “well suited for application of the fraud on the market theory,” Freeman v. Laventhol & Horwath, 915 F.2d 193, 199 (6th Cir. 1990). Accordingly, the listing of a security on a major exchange such as the NYSE or the NASDAQ weighs in favor of a finding of market efficiency. See Oran, 226 F.3d at 282; see also Schleicher, 618 F.3d at 682; Freeman, 915 F.2d at 199.
In re DVI, Inc. Sec. Litig., 639 F.3d 623, 634 (3rd Cir. 2011).
13. John Y. Campbell, Andrew W. Lo & A. Craig MacKinlay, The Econometrics of Financial Markets 24 (1997).
14. In Halliburton Co. v. Erica P. John Fund, Inc., the defendant urged the Supreme Court to overrule Basic’s presumption of reliance in part arguing that “the Basic Court espoused ‘a robust view of market efficiency’ that is no longer tenable, for ‘overwhelming empirical evidence’ now ‘suggests that capital markets are not fundamentally efficient.’” Halliburton Co. v. Erica P. John Fund, Inc., 573 U.S. 258, 270 (2014). The Supreme Court, however, rejected the arguments and upheld the fraud-on-the-market theory of reliance noting that “Basic recognized that market efficiency is a matter of degree and accordingly made it a matter of proof.” Id. at 272.
15. See, e.g., J.B. Heaton, Kill Cammer: Securities Litigation Without Junk Science, Wm. & Mary Bus. L. Rev. (forthcoming).
16. See, e.g., Eugene F. Fama, Efficient Capital Markets: II, 46 J. Fin. 1575 (1991); Eugene F. Fama, Two Pillars of Asset Pricing, 104 Am. Econ. Rev. 1467 (2014).
17. Michael L. Hartzmark & H. Nejat Seyhun, The Curious Incident of the Dog That Didn’t Bark and Establishing Cause-and-Effect in Class Action Securities Litigation, 6 Va. L. & Bus. Rev. 415, 429 (2012).
18. See, e.g., Randall S. Thomas & James F. Cotter, Measuring Securities Market Efficiency in the Regulatory Setting, 63 Law & Contemp. Probs. 105 (2000).
19. In October 2008, American Stock Exchange (AMEX) was acquired by NYSE Euronext (now called NYSE American). We also included the NYSE American stocks. We restricted the analysis to companies with a single class of shares and to stocks with “active” trade status and “regular” security status.
20. Daily turnover is calculated as volume divided by shares outstanding. Bid-ask spread is calculated as the difference between ask and bid prices divided by the average of bid and ask prices. Observations that did not meet the following criteria were eliminated from the calculation of bid-ask spreads: bid price > 0; ask price >0; and ask price > bid price. Market capitalization is calculated as the product of closing share price and the number of shares outstanding. If the closing price is not available on any given trading day, the bid/ask average is used.
21. The I/B/E/S analyst recommendation data available to us only report the number of analysts making buy/hold/sell recommendations when such number is positive. Therefore, the benchmarking statistics for the average number of analysts making recommendations may be conservatively high. While we could assume that the number is zero when data are missing, we refrain from doing so to avoid inadvertently assigning a zero when in fact the data may be missing.
22. Marco Pagano, Trading Volume and Asset Liquidity, 104 Q.J. Econ. 255, 255 (1989).
23. Cammer v. Bloom, 711 F. Supp. 1264, 1286 (D.N.J. 1989).
24. Jonathan Brogaard, Terrence Hendershott & Ryan Riordan, High-Frequency Trading and Price Discovery, 27 Rev. Fin. Stud. 2267, 2267 (2014).
25. Tarun Chordia, Richard Roll & Avanidhar Subrahmanyam, Recent Trends in Trading Activity and Market Quality, 101 J. Fin. Econ. 243, 244 (2011).
26. The Cammer court noted that weekly trading volume of two percent or more of the outstanding shares would justify a “strong presumption” of market efficiency; one percent would justify a “substantial presumption.” Cammer, 711 F. Supp. at 1286.
27. See, e.g., In re Alstom SA Securities Litigation, 253 F.R.D. 266, 280 (S.D.N.Y. 2008) (finding that an average weekly trading volume of 4.3% (along with other efficiency factors) was sufficient evidence for establishing market efficiency, noting that the turnover exceeded the 1-2% benchmark set forth in Cammer).
28. Research published by so-called sell-side analysts is typically available to investors. These analysts are employed by full service financial firms such as investment banks. In contrast, research by so-called buy-side analysts, employed by institutional investors such as hedge funds and mutual funds, is available exclusively to their employers.
29. Sok Tae Kim, Ji-Chai Lin & Myron B. Slovin, Market Structure, Informed Trading, and Analysts’ Recommendations, 32 J. Fin. & Quantitative Analysis 507, 507 (1997).
30. Jennifer Francis & Leonard Soffer, The Relative Informativeness of Analysts’ Stock Recommendations and Earnings Forecast Revisions, 35 J. Accounting Res. 193 (1997); Thomas Lys & Sungkyu Sohn, The Association Between Revisions of Financial Analysts’ Earnings Forecasts and Security-Price Changes, 13 J. Accounting & Econ. 341 (1990); Alon Brav & Reuven Lehavy, An Empirical Analysis of Analysts’ Target Prices: Short‐term Informativeness and Long‐term Dynamics, 58 J. Fin. 1933 (2003).
31. “Analyst coverage is the most widely-accepted method of measuring when securities markets are efficient at processing information. Academic commentators have agreed that analyst coverage is an important mechanism for disseminating information to the market.” Thomas & Cotter, supra note 18, at 111.
32. Id. at 114.
33. Dirks v. Sec. Exch. Comm’n, 463 U.S. 646, 658 n.17 (1983).
34. See, e.g., In re Xcelera.com Sec. Litig., 430 F.3d 503, 514 (1st Cir. 2005) (“[T]he greater the number of securities analysts following and reporting on a company’s stock, the greater the likelihood that information released by a company is being relied upon by investors.”).
35. Cammer v. Bloom, 711 F. Supp. 1264, 1286 (D.N.J. 1989) (citation omitted).
36. Yakov Amihud & Haim Mendelson, Asset Pricing and the Bid-Ask Spread, 17 J. Fin. Econ. 223, 223 (1986).
37. Harold Demsetz, The Cost of Transacting, 82 Q. J. Econ. 33 (1968).
38. See, e.g., Vinh Nguyen v. Radient Pharms. Corp., 287 F.R.D. 563, 574 (C.D. Cal. 2012) (finding a bid-ask spread of 0.58 percent supported market efficiency); and In re Scientific-Atlanta Sec. Litig., 571 F. Supp. 2d 1315, 1339 (N.D. Ga. 2007) (finding that a bid-ask spread that “never exceeded 1.9%” weighed heavily in favor of a finding of market efficiency).
39. Yakov Amihud & Haim Mendelson, Asset Pricing and the Bid-Ask Spread, 17 J. Fin. Econ. 223 (1986).
40. Id. at 224.
41. Frank Torchio & Sunita Surana, Effect of Liquidity on Size Premium and its Implications for Financial Valuations, 9(1) J. Bus. Val. Econ. Loss Anal. 55, 61 (2014).
42. Thomas & Cotter, supra note 18, at 106.
43. Id. at 119.
44. See, e.g., In re Alstom SA Sec. Litig., 253 F.R.D. 266, 280 (S.D.N.Y. 2008) (“the Court finds that because institutional investors held a substantial percentage of Alstom’s securities and because these investors could easily buy and sell Alstom’s securities on exchanges such as the NYSE and Euronext Paris, they have likely acted as arbitrageurs and facilitated the efficiency of the market.”).
45. Thomas & Cotter, supra note 18, at 117.
46. See, e.g., Krogman v. Sterritt, 202 F.R.D. 467, 478 (N.D. Tex. 2001) (“Market capitalization, calculated as the number of shares multiplied by the prevailing share price, may be an indicator of market efficiency because there is a greater incentive for stock purchasers to invest in more highly capitalized corporations.”).
47. Ekkehart Boehmer & Juan Wu, Short Selling and the Price Discovery Process, 26 Rev. Fin. Stud. 287 (2012).
48. See, e.g., Vinh Nguyen v. Radient Pharms. Corp., 287 F.R.D. 563, 573 (C.D. Cal. 2012).
49. Cammer v. Bloom, 711 F. Supp. 1264, 1271 (D.N.J. 1989).
50. About Nasdaq, https://www.nasdaq.com/about/about_nasdaq.aspx (last visited Apr. 28, 2020).
51. 17 C.F.R. § 240.12 (2019).
52. The NYSE Market Model, https://www.nyse.com/market-model (last visited Apr. 28, 2020).
53. Larry Harris, Trading and Exchanges: Market Microstructure for Practitioners 401 (2003).
54. Cammer v. Bloom, 711 F. Supp. 1264, 1282–83 (D.N.J. 1989).
55. See, e.g., In re Xcelera.com Sec. Litig., 430 F.3d 503, 511 (1st Cir. 2005).
56. Burton Malkiel, Efficient Market Hypothesis, 2 The New Palgrave: A Dictionary of Economics 120–23 (John Eatwell, Murray Milgate, & Peter Newman eds., 1987) (“The term ‘random walk’ is usually used loosely in the finance literature to characterize a price series where all subsequent price changes represent random departures from previous prices. Thus, changes in price will be unrelated to past price changes.”)
57. Eugene F. Fama, Efficient Capital Markets: A Review of Theory and Empirical Work, 25 J. Fin. 383, 394 (1970) (footnote omitted).
58. Id. at 396.
59. See, e.g., Vinh Nguyen v. Radient Pharms. Corp., 287 F.R.D. 563, 575 (C.D. Cal. 2012).
60. Eugene E. Comiskey, Ralph A. Walkling & Michael A. Weeks, Dispersion of Expectations and Trading Volume, 14 J. Bus. Fin. & Acct. 229 (1987); Robert L. Crouch, A Nonlinear Test of the Random-Walk Hypothesis, 60 Am. Econ. Rev. 199 (1970).
61. Jonathan M. Karpoff, The Relation Between Price Changes and Trading Volume: A Survey, 22(1) J. Fin. & Quantitative Analysis 109, 121 (1987).
62. Karpoff notes that one interpretation is that price movements are viewed as the market’s assessment of new information while trading volume is viewed as a reflection of changes in the expectations of individual investors. See id. at 110.
63. See, e.g., Vinh Nguyen v. Radient Pharms. Corp., 287 F.R.D. 563, 574 (C.D. Cal. 2012).
64. Volume is adjusted for splits and stock dividends.
65. As noted recently by the court in Weiner v. Tivity Health:
“[T]he listing of a security on a major exchange such as the NYSE or the NASDAQ weighs in favor of a finding of market efficiency.” Basic, 485 U.S. at 241–42. This is because those securities markets are “open and developed” and “[t]he high level of trading activity ensures that information from many sources is disseminated into the marketplace and consequently is reflected in the market price. Freeman v. Laventhol & Horwath, 915 F.2d 193, 199 (6th Cir. 1990). “This is the premise upon which the fraud on the market theory rests.” Id. Thus, even though it is not a per se rule, “securities trading on national exchanges like the NYSE [and the NASDAQ) ‘are often presumed to be traded on an efficient market,’ . . . precisely because the exchanges are generally populated by stocks that are closely watched by analysts and that trade at a high volume.” Local 703, I.B. of T. Grocery & Food Emp. Fund v. Regions Fin. Corp., 762 F.3d 1248, 1257 (11th Cir. 2014).
Weiner v. Tivity Health, 2020 U.S. Dist. LEXIS 14671, at *19–20 (M.D. Tenn. 2020). See also In re DVI, Inc. Sec. Litig., 639 F.3d 623, 634 (3rd Cir. 2011).
66. See, e.g., In re Accredo Health, Inc., Sec. Litig., 2006 U.S. Dist. LEXIS 97621, at *33-34 (W.D. Tenn. 2006) (In order for the court to conclude that a market is efficient, “it is not necessary that a stock satisfy all five factors.” Simpson v. Specialty Retail Concepts, Inc., 823 F. Supp. 353, 355 (M.D.N.C. 1993); see also Lehocky v. Tidel Techs., Inc., 220 F.R.D. 491, 509; Cammer v. Bloom, 711 F. Supp. 1264, 1287. Rather than apply the factors as a checklist, they are to be used as an analytic tool by the court to assist in its market efficiency determination. Unger v. Patterson, 401 F.3d 316, 325 (5th Cir. 2005).).
67. In this example, the test statistic is: t = (sample mean – population mean under the null hypothesis) / standard error.
The authors would like to thank Thomas Torchio for research assistance and the editors of the University of Illinois Law Review for helpful suggestions.
The full text of this Article is available to download as a PDF.